|
|
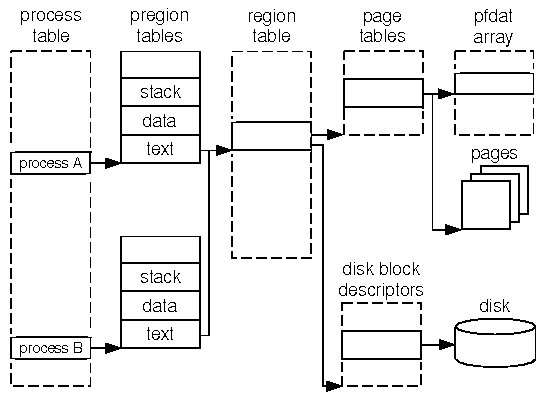
Each process has a per-process region (pregion) table associated with it that points to the regions that are private to it or that it shares with other processes. ``The relationship between a process' pregion table and the system region table'' shows how a process's pregion entry points into the system region table. This entry in the region table may be shared with other processes if it refers to program text (executable code).

The relationship between a process' pregion table and the system region table
To determine the current memory utilization of a process, you must add together the number of pages of physical memory that are described by the process' regions. If the size of several processes is being determined, you need to take care not to count shared regions more than once.
Use the proc and region commands of crash(ADM) to determine the size of a process as follows:
SLOT ST PID   PPID  PGRP UID PRI CPU EVENT        NAME         FLAGS
  11 s    17    12    12   0  33   0 proc+0x968   smallapp     load nxec
The number in the first column (
SLOT)
is the process table slot number.
The process ID is shown under the column PID.
In this example, the program smallapp has process
ID 17 and occupies slot 11 in the process table.
   PREG REG#      REGVA  TYPE FLAGS
      0   12          0  text rdonly
      1   20   0x400000  data
      2   21 0x7ffffffc stack
The REG# column of this output shows
the region table entries
associated with this process;
REGVA shows
the virtual address of this region.
TYPE identifies whether
this region is text, data, stack, library text,
library data, and so on;
FLAGS identifies
the characteristics of the region
(read-access, write access, and so on).
> reg 12 20 21

SLOT  PGSZ VALID  SMEM NONE SOFF  REF SWP NSW FORW BACK INOX TYPE FLAGS
  12     1     1     1    0    0   13   0   0   14    8   35 stxt done
  20     1     1     1    0    0    1   0   0  267   21   35 priv done
  21     2     1     1    0    0    1   0   0  267   22      priv stack
The PGSZ column represents the maximum size of the region in pages.
The VALID column indicates the number of 4KB pages
that are currently in RAM.
The TYPE column shows whether this is a private region
(priv) or a shared text region (stxt).
Summing the #VL sizes
of all regions for the process
shows the number of pages of memory
being used by a program
if it is only invoked once on the system.
In this case, the sum is 3 pages.
If multiple invocations of a program
are run on a system,
you can sum the #VL sizes for their
shared text and private regions separately;
the same amount of memory will be dedicated
to shared text regions regardless of how many
invocations of that program are running.
The sum of the #VL sizes
for private regions is the amount of extra memory
that will be consumed by each subsequent invocation
of this program.
You can use the rtop command of crash to find which regions are shared by processes. For example to determine which processes share regions 0 through 4, issue the command rtop 0..4.
Use the region and rtop commands of crash to identify the largest processes on the system.
> reg | sort +1rn | head -5 | awk '{print $1}'
12
5
8
0
1
The example output from this command
shows the five largest regions in decreasing order of size.
The output from this command will show the process table entries associated with each of the specified regions.>rtop 12 5 8 0 1